Bchart: Chart Generator In Blender
Bchart
Bchart is the best way to show your data in simple and animated charts.
Versions available:
v.1.0.3: first stable release.
v.1.1.1: added data update functionality. (tested in Windows).
v.1.2.1: vertical/horizontal orientation, f(x)=y (LINE and AREA charts can be scaled along x-axis based on label's values), more accurate animation system.
v.1.2.2: support for Blender 2.9x + 3D CHARTS!! Currently in testing, do not use this type of chart for production purposes.
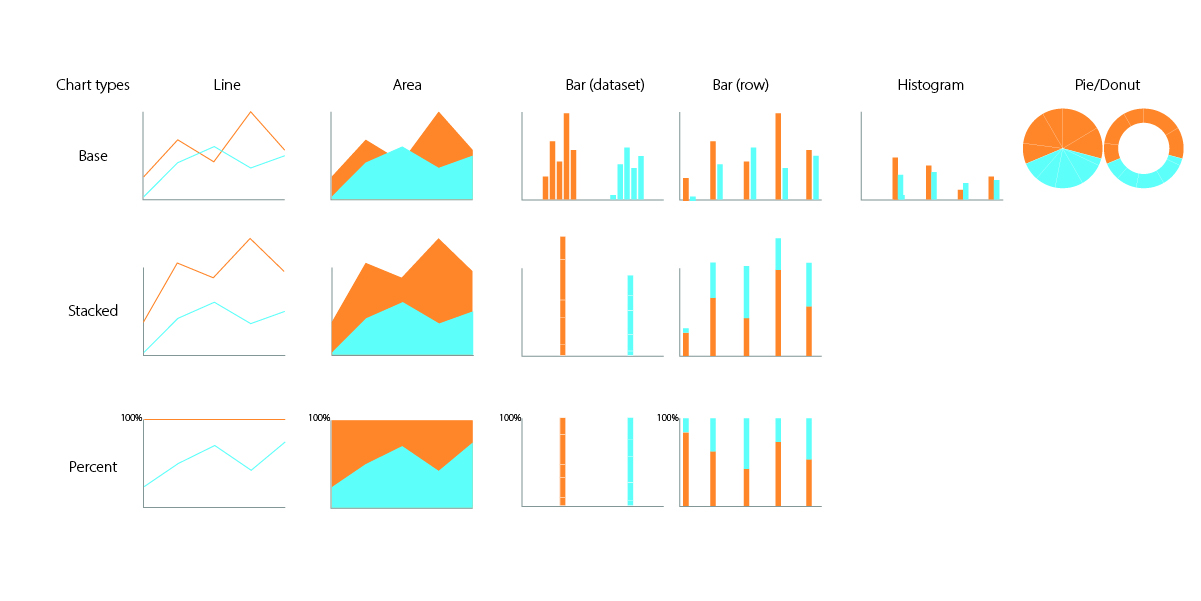
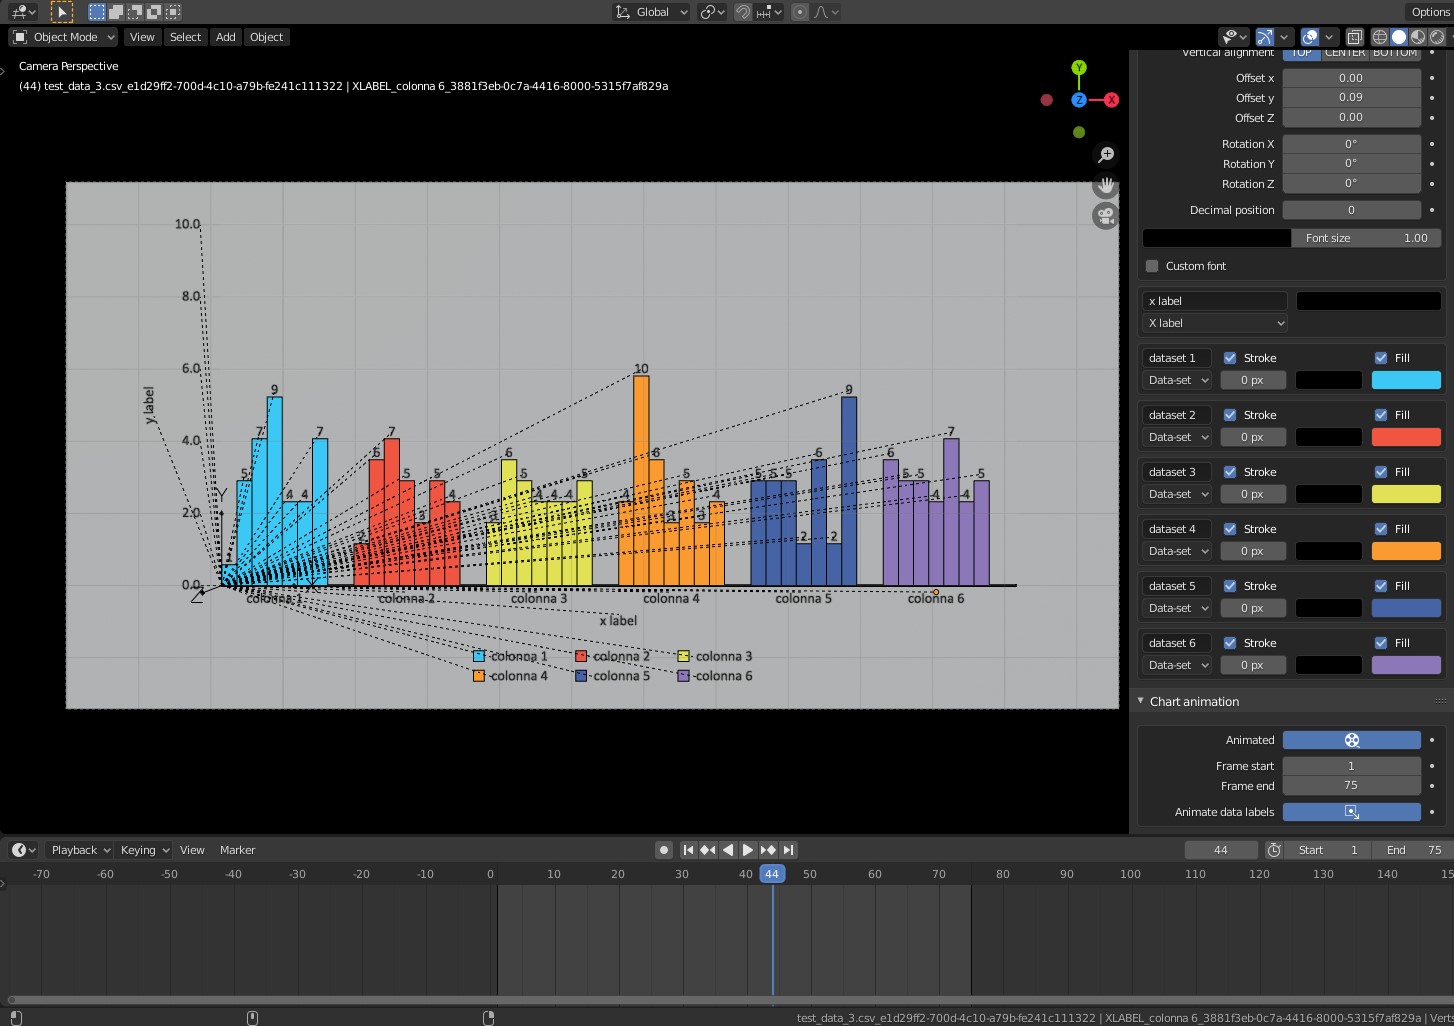
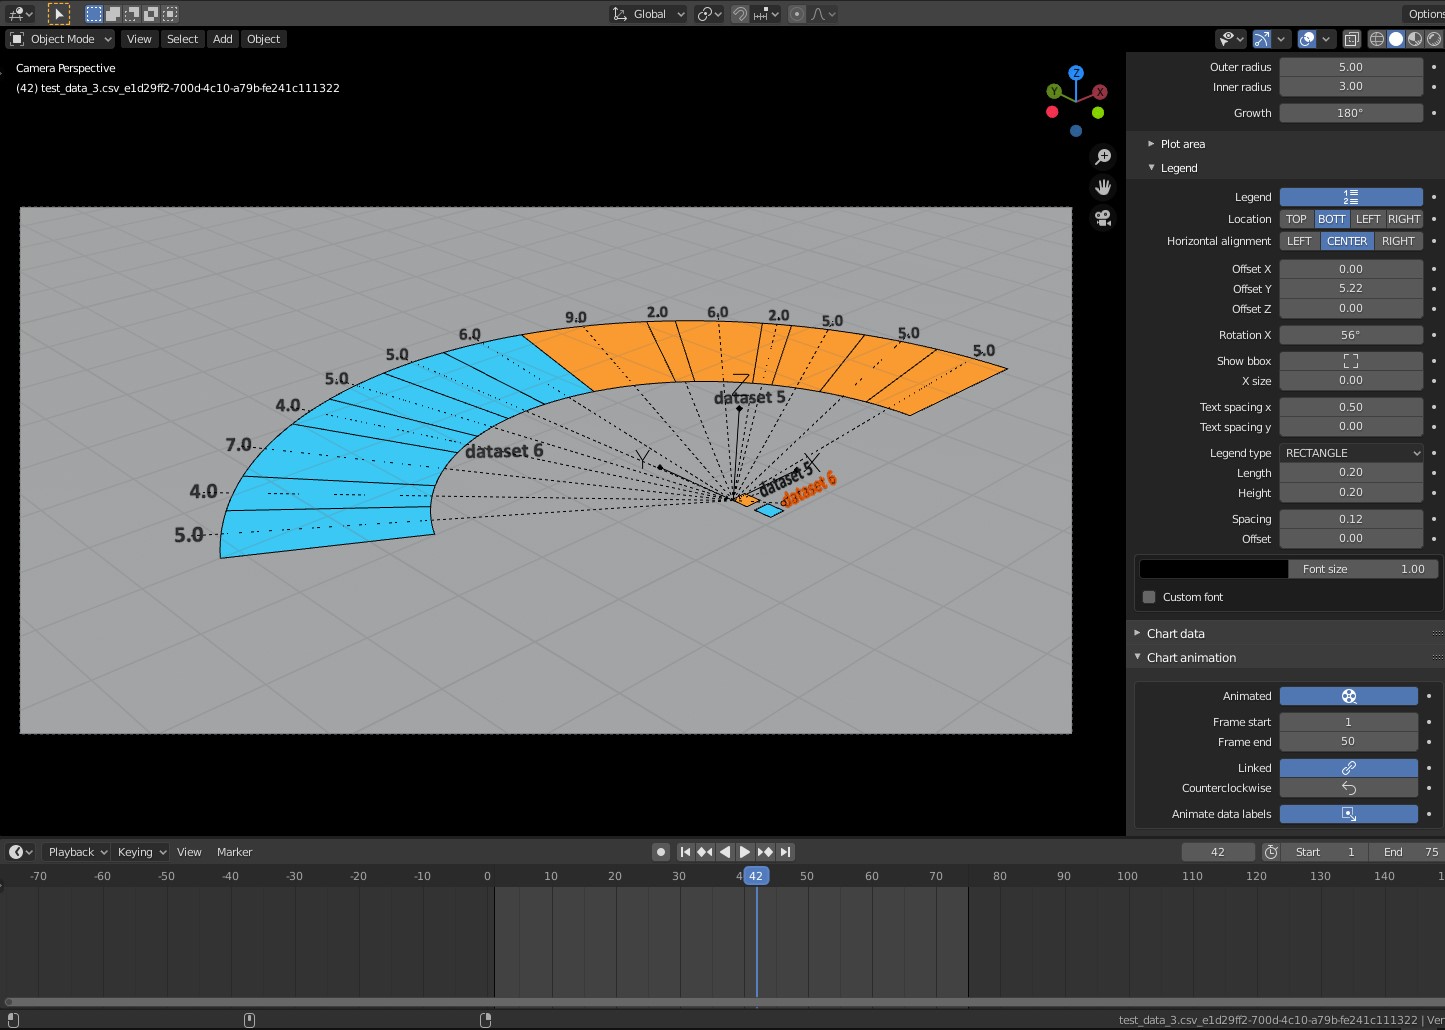
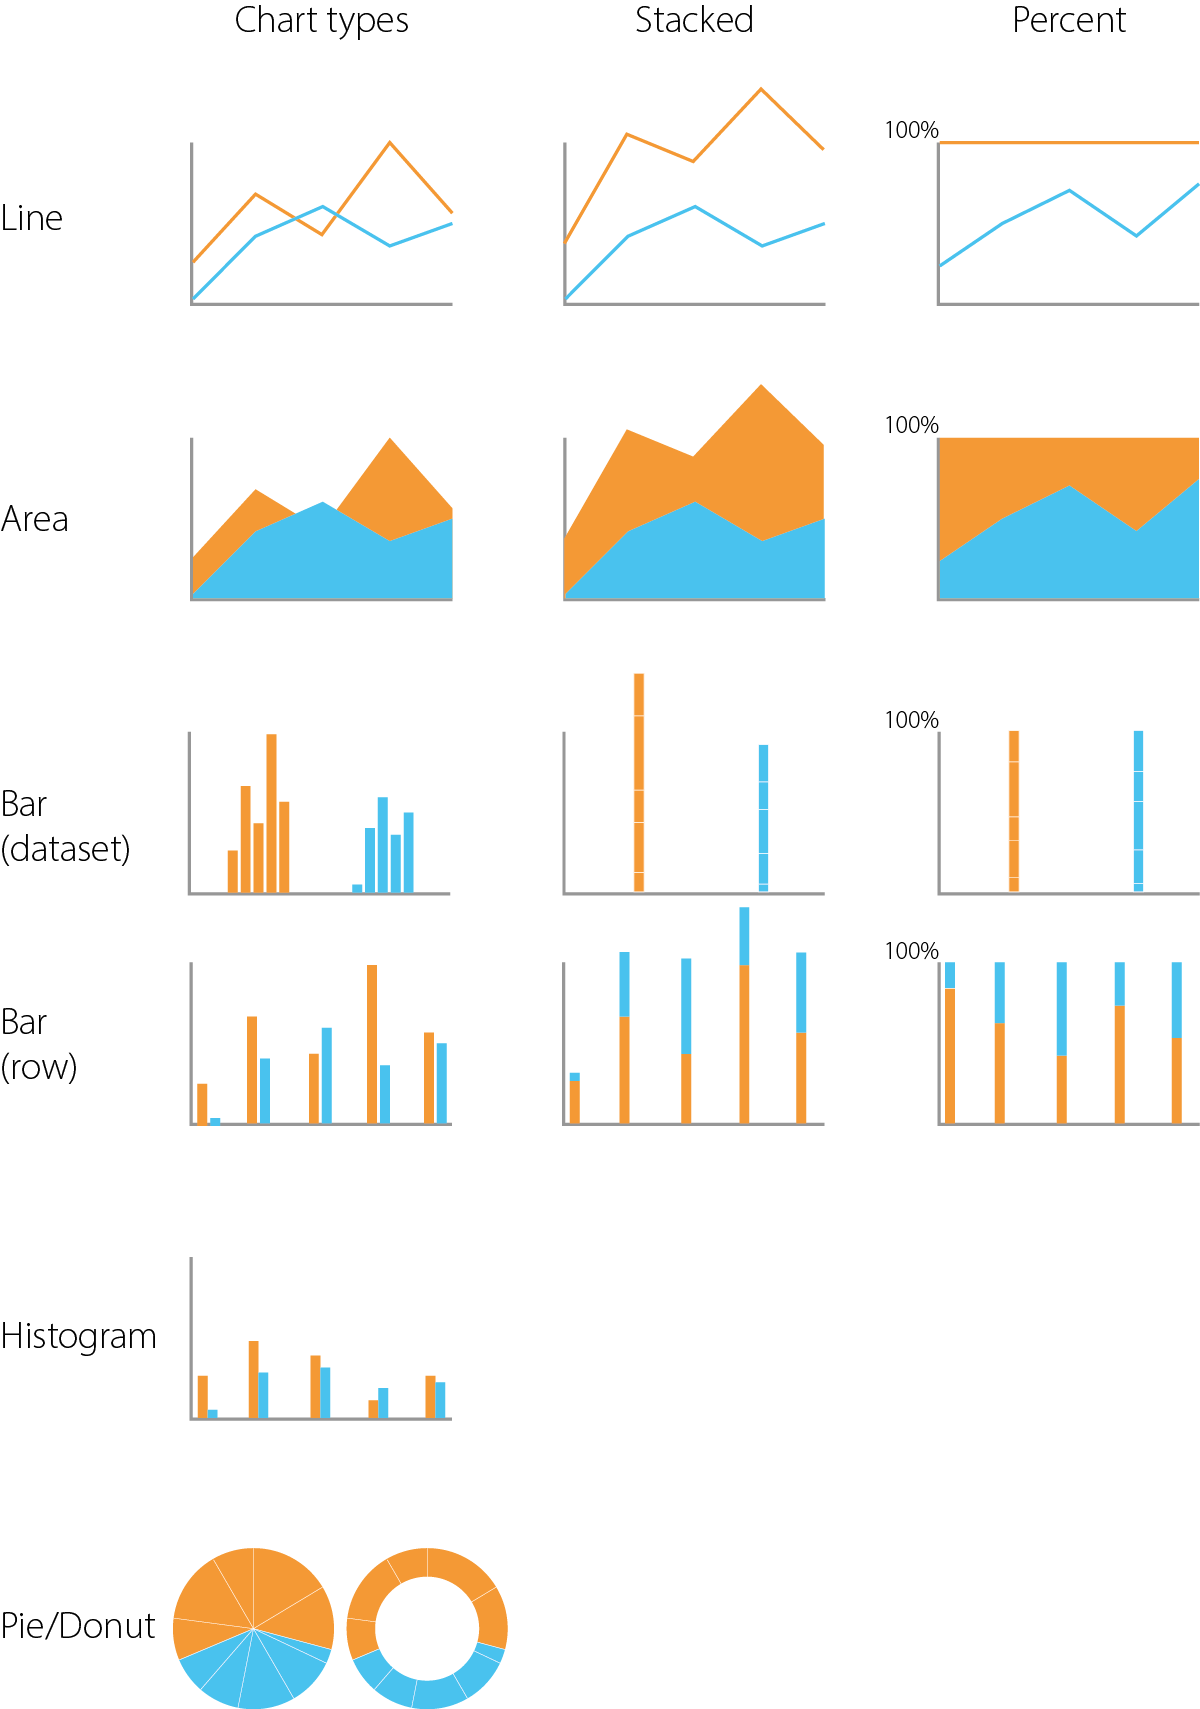
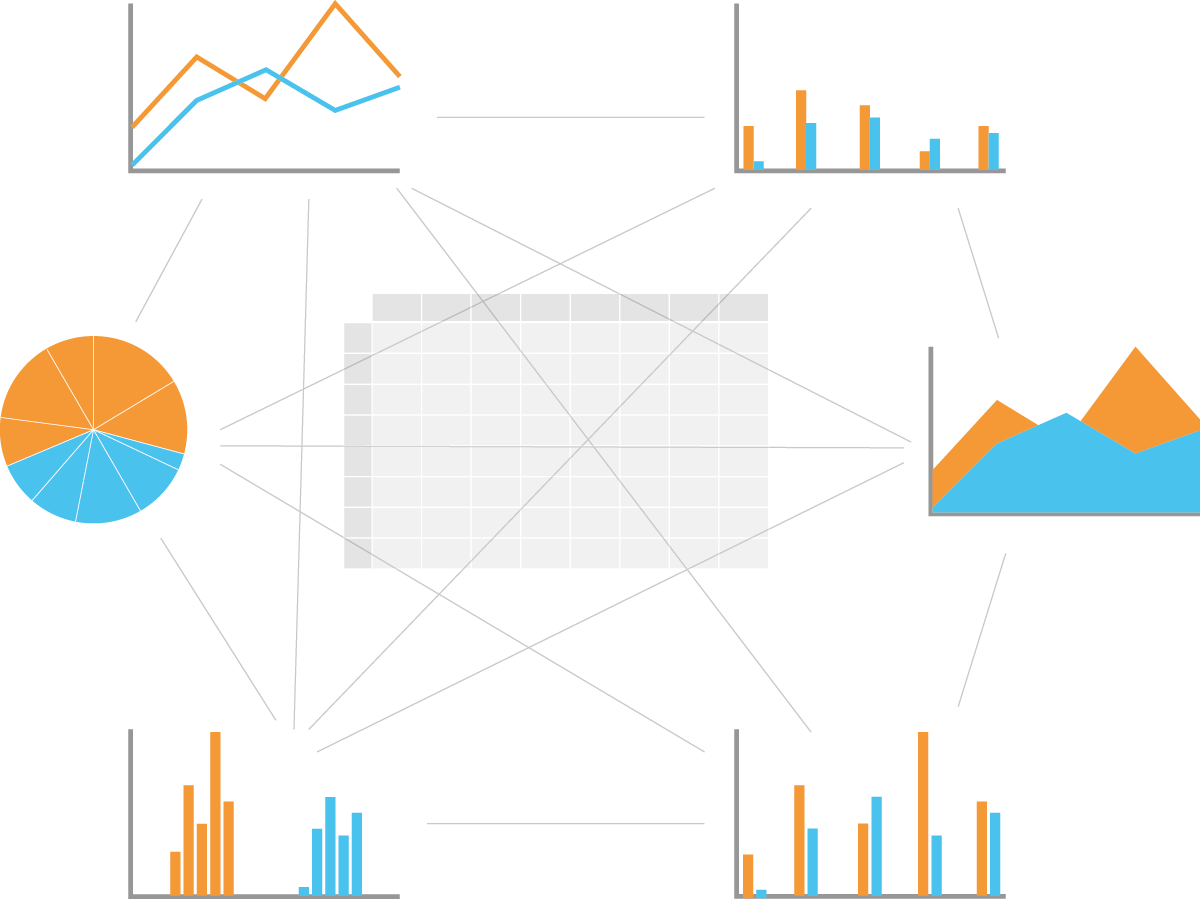
5+ 2D chart types (and variants)
Main features
(Also have a look into the documentation page)
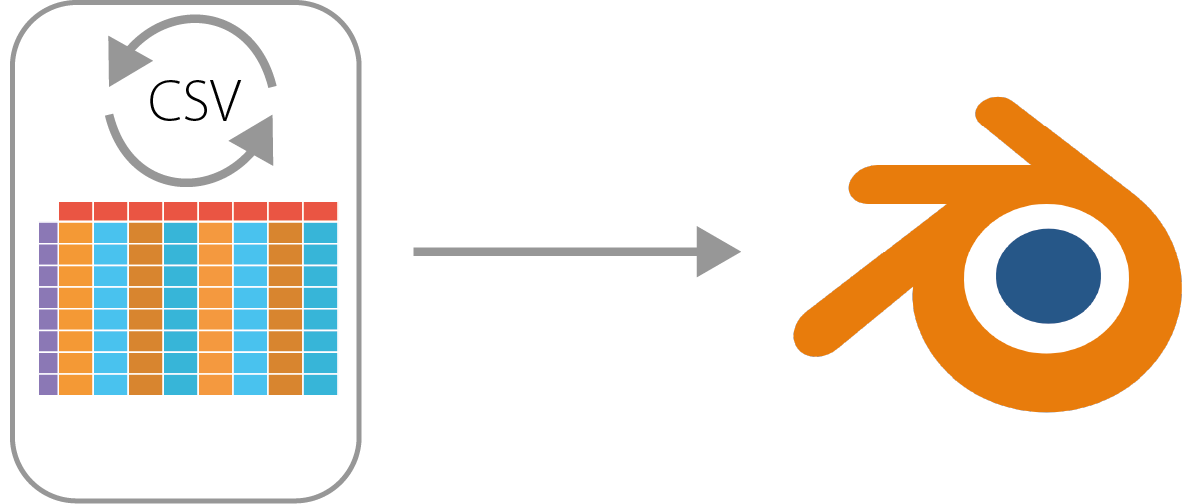
- Import .csv data into Blender and create/remove charts; data can change over time , so you can refresh it at any time directly from the addon interface, without losing any settings;
- Change chart type at anytime;
- Tweak more than 30 parameters to create the best looking chart ever.
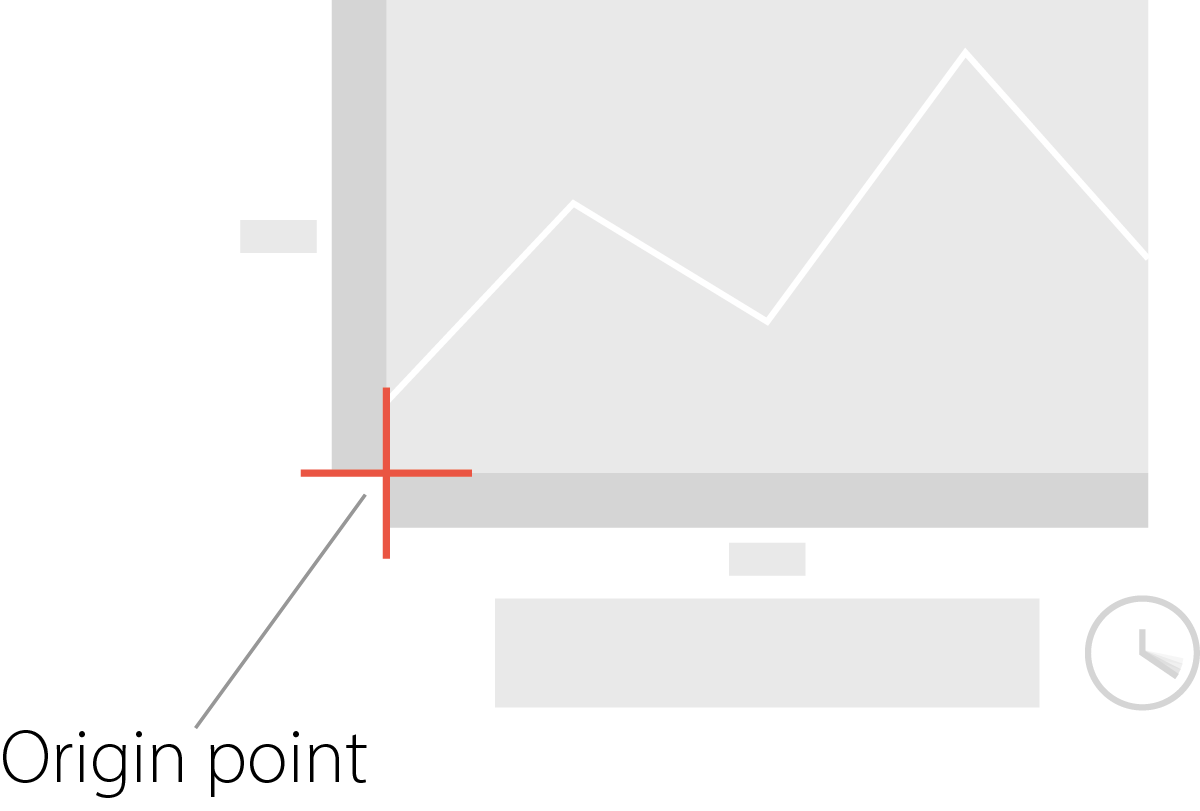
- The chart has an origin point to move, rotate and scale it.
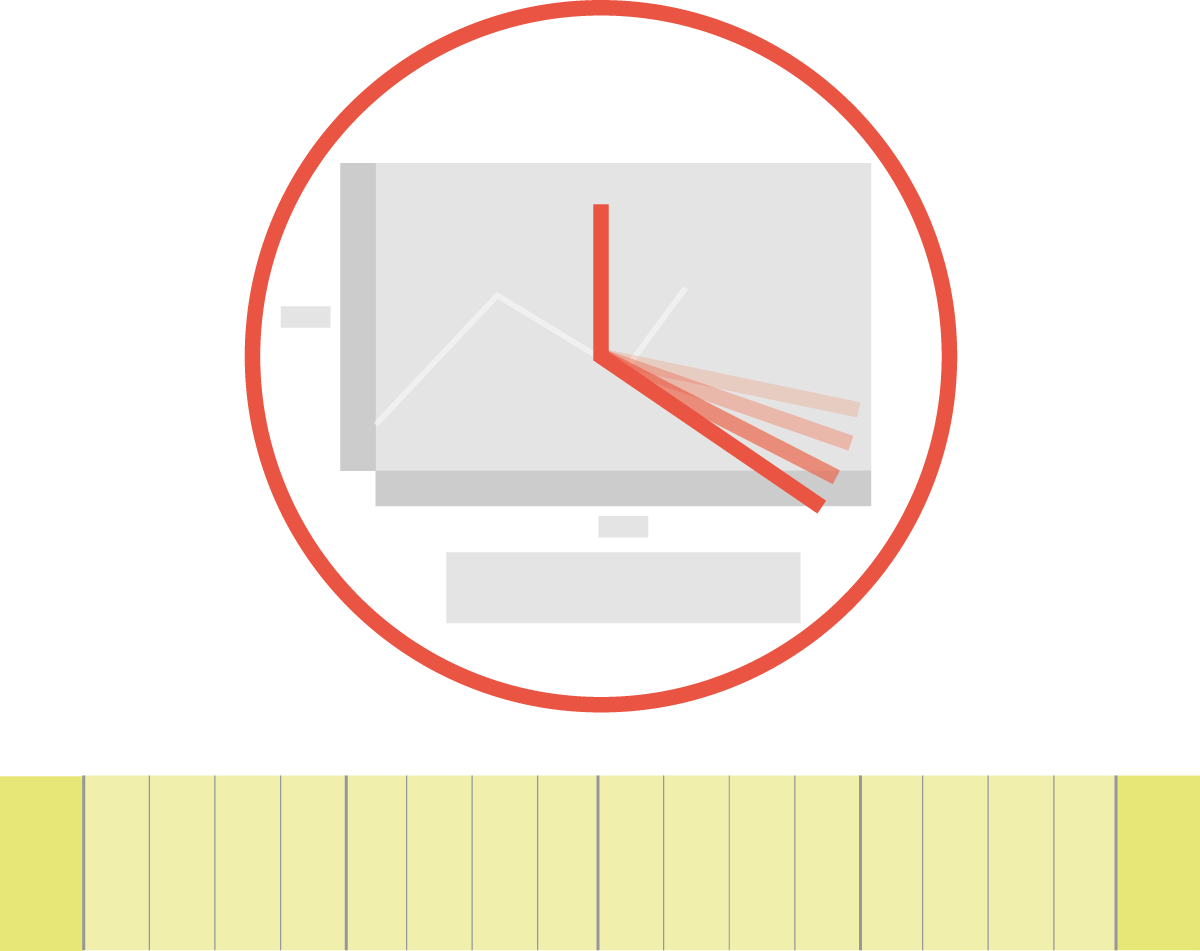
- Add animation in one click.
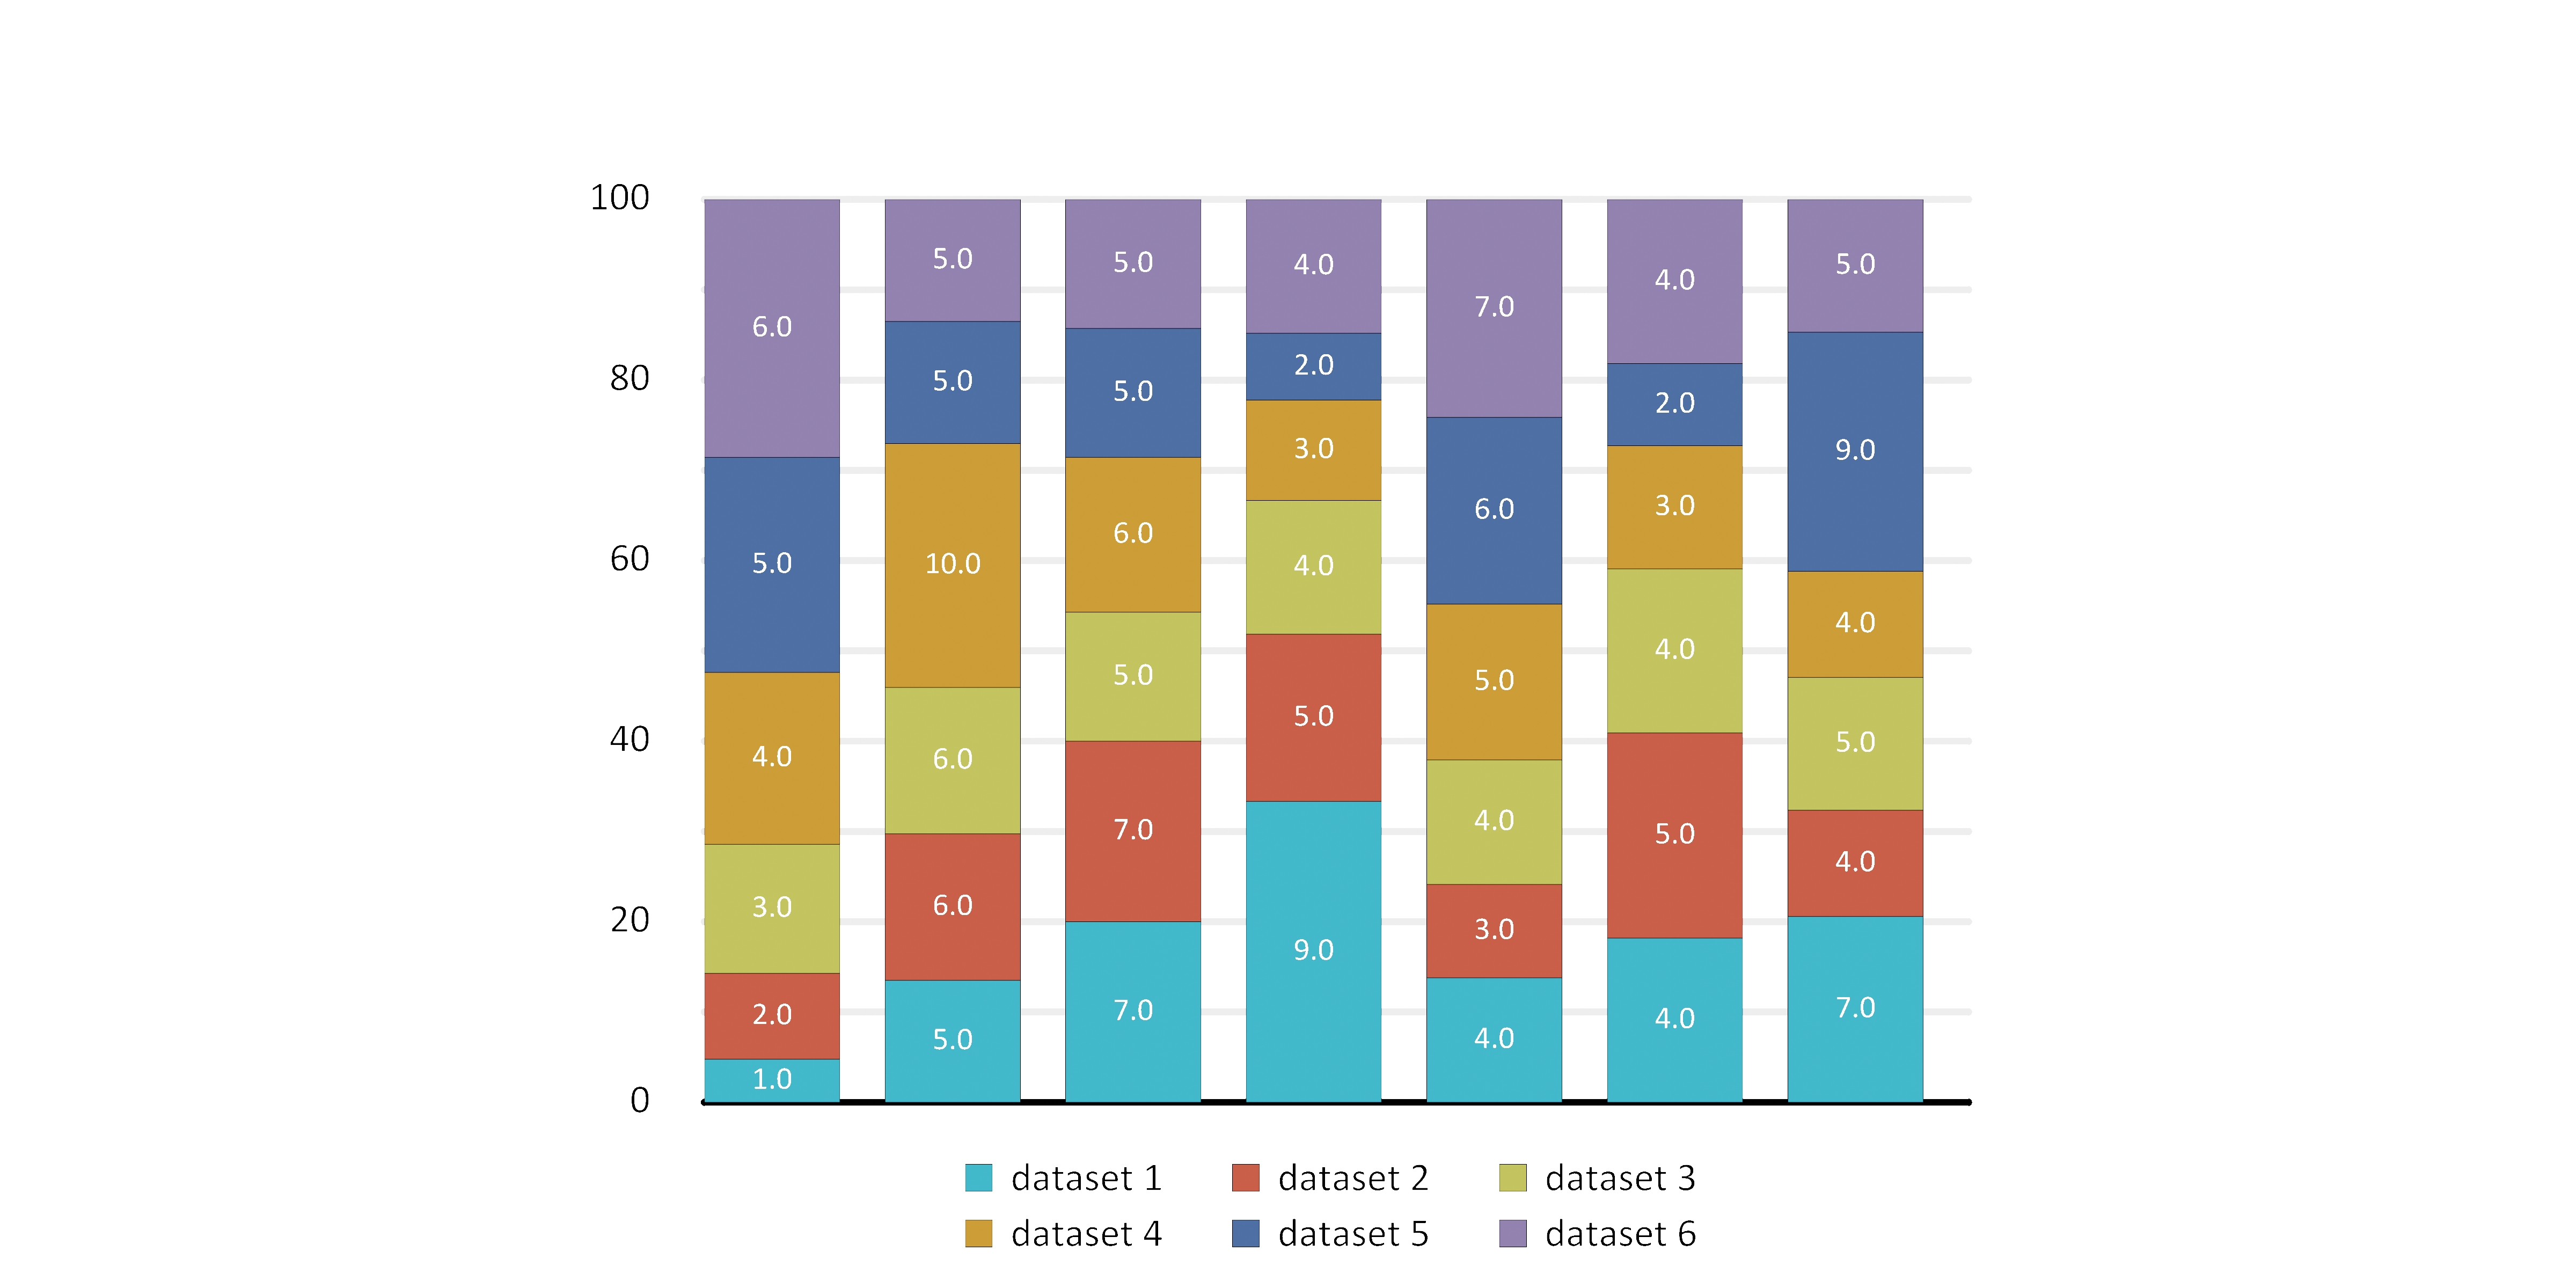
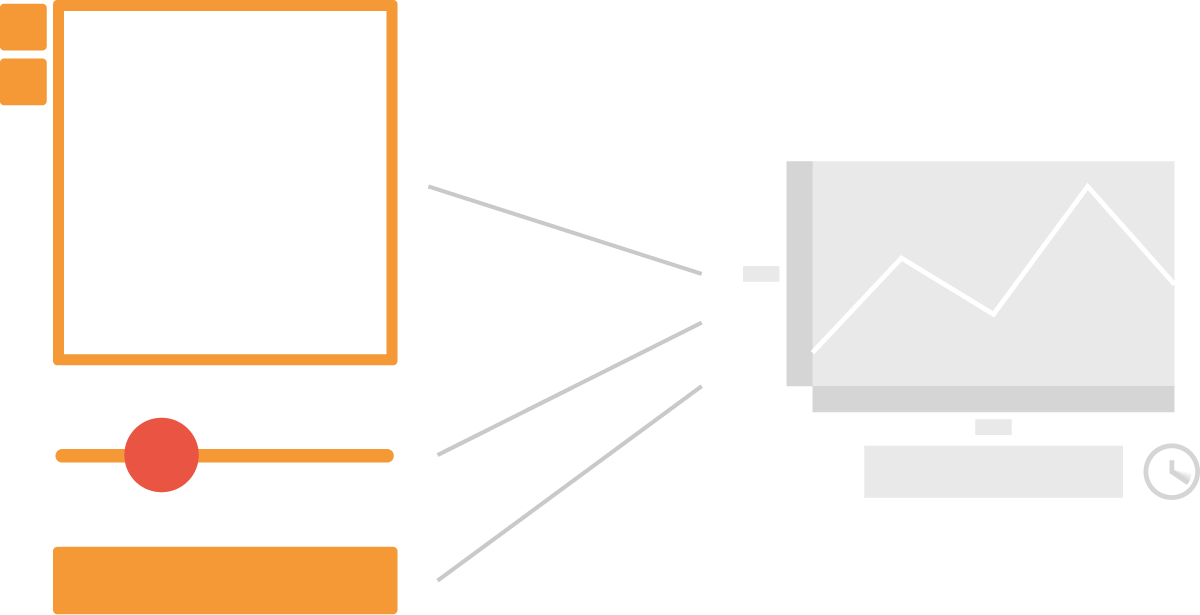
Anatomy of a chart
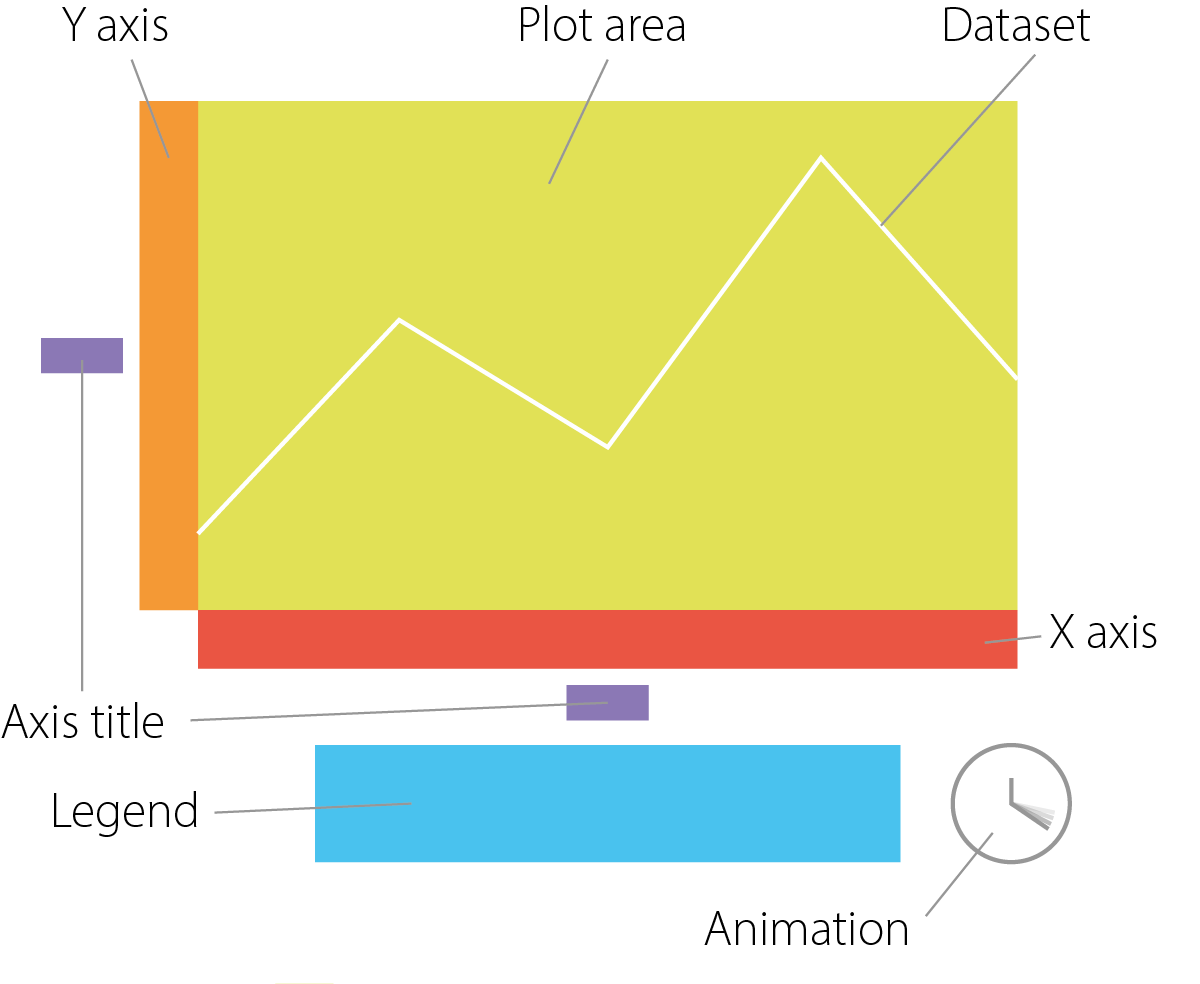
Chart elements
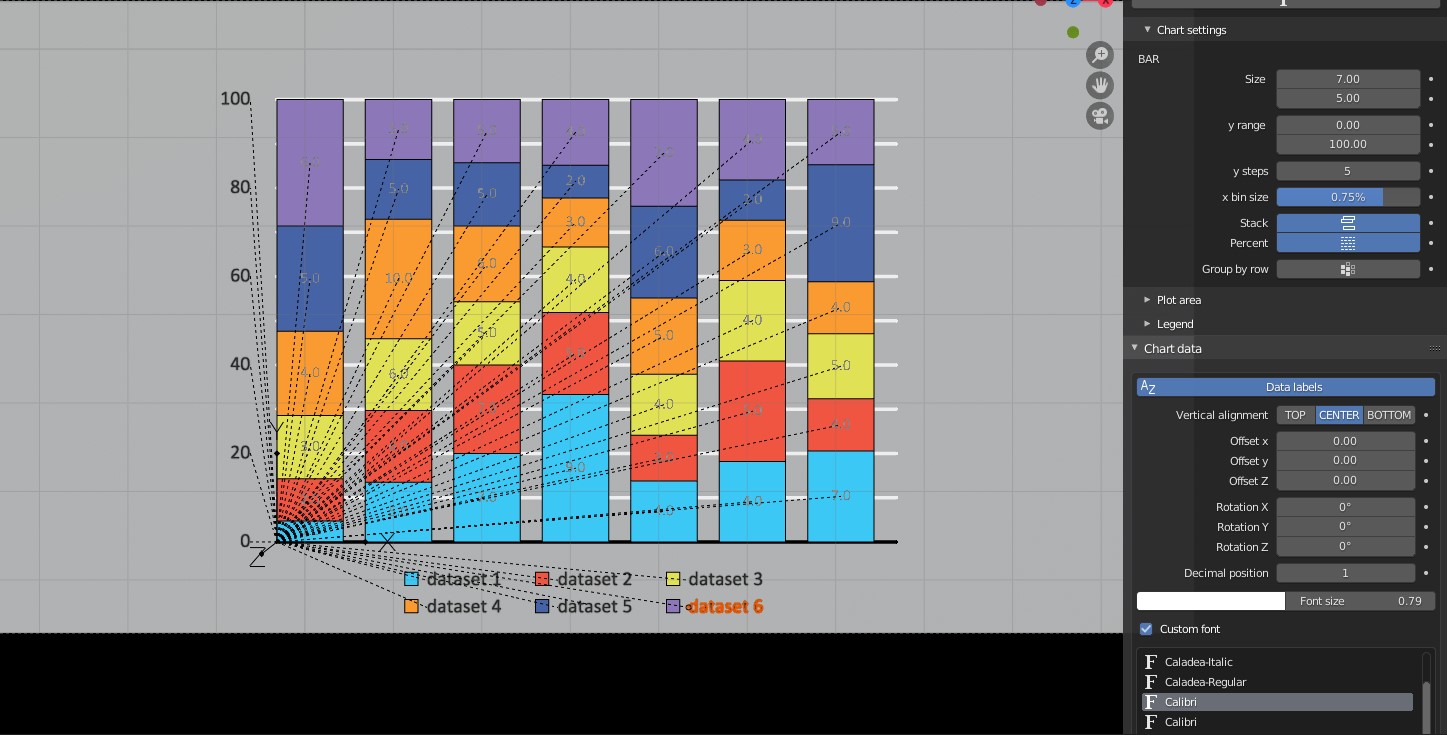
Interface
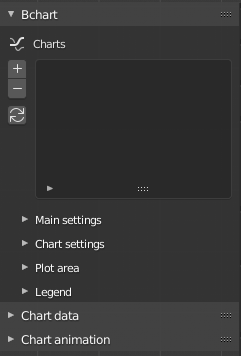
Bchart main panel
Dataset structure
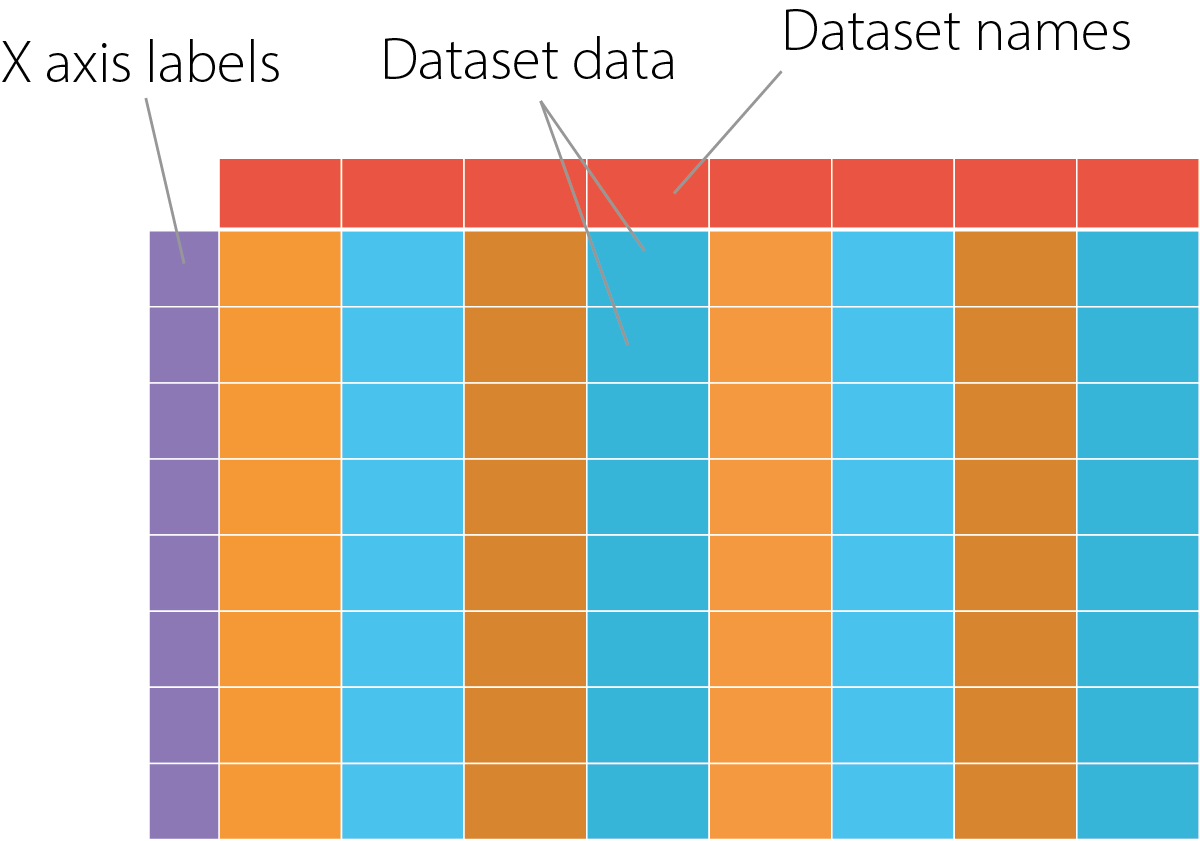
Data has to be organized in column.
Each column represents a dataset: while the first line contains the name of the dataset; each subsequent row can be populated with data.
The first column on the left will be considered as 'X axis' data, but any other column can be chosen at any time in the add-on settings. Just remember that you can only use one column/dataset at a time as a source for "x axis labels".
Important notes
- The data in the .csv file must be delimited by semicolons.
- Do not change the name of the objects, this would make them unrecognizable to the addon.
- It uses Grease Pencil objects and materials to generate charts, along with text objects for labels. So if you want to manually modify them you can do it anytime, but i can't guarantee that the addon will work properly after the changes.
- The name of the .csv file is used as the name of the chart. Currently it cannot be changed, but I am working on making it possible.
- Currently it only supports numeric values into the "plot area". That said, you can still use textual data for dataset used as "x axis values" (Into the first column by default, but also in the others if you want).
I try to maintain the addon updated with little improvements or bug fixes, so sometimes check the download page to see if new versions are available. For major changes or added features i will send an email.
For the future
I am working on a style system, and my idea is to add new types of charts, animations and supported data sources in addition to .csv: you can give suggestions by contacting me using the product support button "Ask a question" on this page. I will reply as soon as possible.